AMD Radeon RX 7800 XT Review
Taking the fight to the RTX 4070




Verdict
The AMD Radeon RX 7800 XT is laser-focused on taking the fight to the RTX 4070. It absolutely nails that ambition. Throughout my testing, it easily supplanted the RTX 4070 at 4K and 1440p gaming, all at a cheaper price. But, now, the RTX 4070 Super is around to bite back. Still, it remains a solid card, and if you prefer Team Red over Green, it’s a decent value pick for 4K gaming.
Pros
- Average 4K framerates above 60
- Good overall pricing
- 16GB of VRAM should give it longevity
Cons
- Not quite as potent as RTX 4070 Super
- Ray tracing still lags behind Nvidia
Key Features
- Modern architectureRDNA 3 architecture and a mix of TSMC’s N5 and N7 7nm transistors, bringing top-tier performance to a mid-range card.
- High graphical memory16GB GDDR6 VRAM to enable 4K textures and more for the next few years at least.
- Reference card designAMD’s come a long way with its reference graphics cards, and this default unit keeps things quiet and cool, with decent clock speeds too.
Introduction
AMD’s Radeon RX 7800 XT is an incredibly promising mid-range GPU. Priced at around $500 at its launch, AMD set out to cement this card as a direct competitor to the likes of Nvidia’s GeForce RTX 4070.
As the vast majority of the graphics market typically lies in the mid-range, rather than the halo products like the RTX 4090 and the 7900XTX, it’s no surprise that this card has fluctuated in price far more aggressively, as Team Red shuffles it around to keep it competitive in comparison to its RTX 4070 competition. Does it top the RTX 4070? And, how does it fair against tougher RTX 4070 competition? Here’s my full AMD Radeon RX 7800 XT review.
Specs
- RDNA 3 modular design remains competitive
- Same base design as 7900 XT and XTX
- Priced more aggressively than competition, with more VRAM
The 7800 XT’s launch was somewhat confusing. That’s mostly down to the launch schedule itself, the 7900 XT landed with us way back in December of 2022, and it took AMD nine more months, for the mid-range solutions to finally appear in the form of the 7800 XT and 7700 XT.
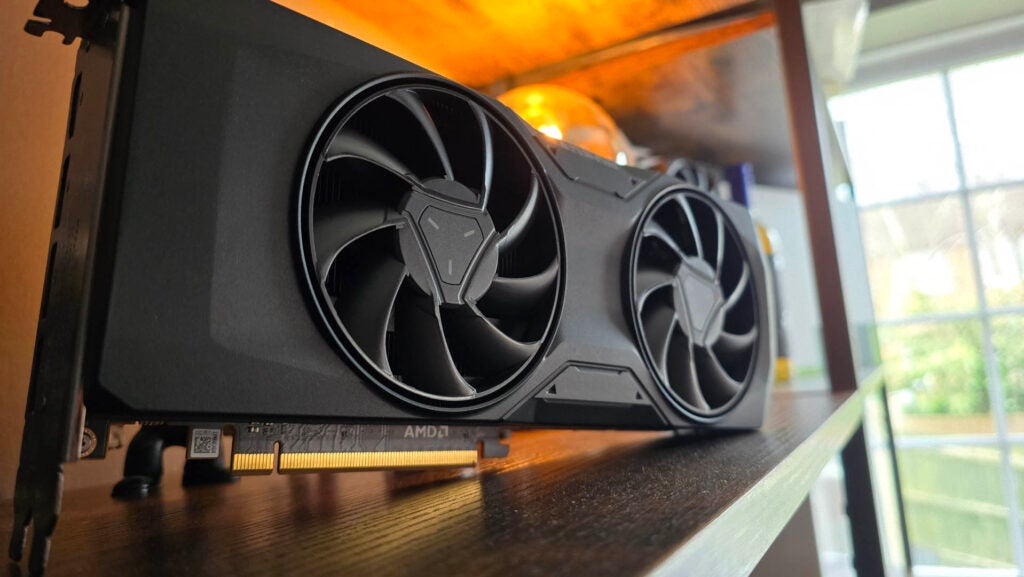
Why that’s curious is because the 7800 XT actually shares a lot in common with the 7900 XT and, its more recent sibling, the (China-only) 7900 GRE. Effectively, these GPUs are based off of the same modular design platform, featuring both TSMC N5 and N6 7nm transistor manufacturing processes, combined with AMD’s RDNA 3 architecture. In short, the 7800 houses 1 graphics compute die, and four memory cache dies. The differences from each model I simply down to how AMD has configured both the number of memory cache die, and which parts of the GCD are enabled by default on each GPU.


At a top level, the 7800 XT features 3,840 shader cores, 240 TMUs, 96 ROPs, 60 Ray accelerators, 120 AI accelerators, and 60 compute units as well. The shader cores are typically what we’re most interested in, as this is what produces the bulk of your in-game graphics performance. The 7800 XT has around 87.5% more than the 7600 XT, and around 28.5% less than the 7900 XT. The real surprise is actually the 7700 XT, which skirts in at just 11% less hardware than the 7800 XT as standard, although the 7700 XT is held back by its 12GB of VRAM as opposed to the 7800 XT’s 16.
It’s the pricing where things get really spicy though, and you can see AMD clearly went out with a mission to take back some market share from Nvidia’s RTX 4070, with the XT coming in at just $499, $100 USD off the 4070’s RRP as standard.
Test Setup
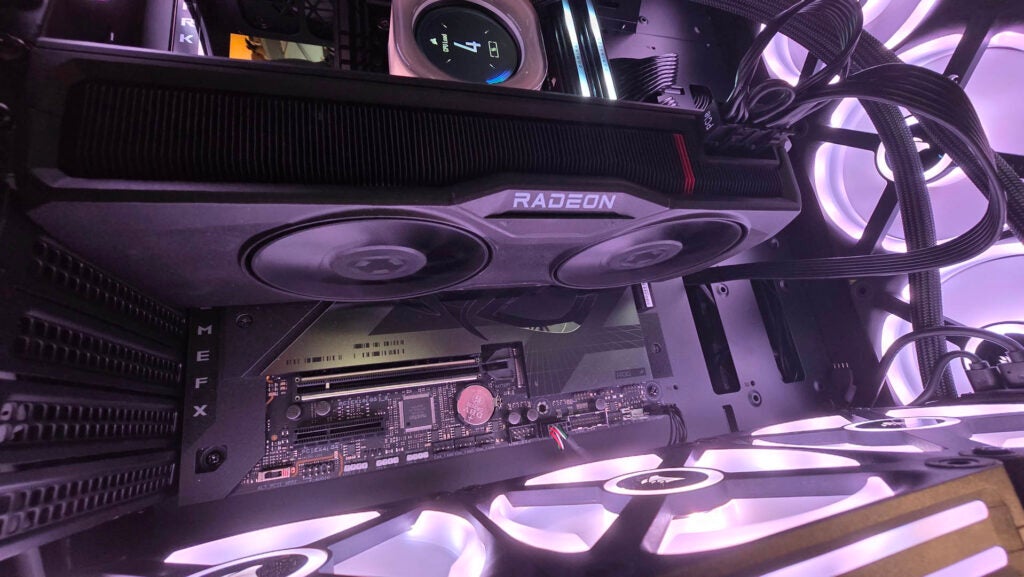
I’ve been testing the RX 7800 XT against a number of its competitors over the last few weeks, benchmarking all of them across a wide variety of both real-world and synthetic benchmarks. I measure as much as I can during this process, from power-draw to temperatures, fan noise, and everything in between to really get to grips with how these cards perform under pressure.
That requires a stable and steady test bed, one that eliminates any potential bottlenecks. To do that, I’ve paired one serious spec list with one of the best gaming CPUs out there right now to ensure that no matter what I test, its the GPU that’s indicating performance rather than anything else.
CPU: Intel Core i9-14900K
RAM: 32GB (2x16GB) Corsair Dominator Titanium @ 7200
Motherboard: ASUS ROG Maximus Z790 Dark Hero
CPU Cooler: Corsair iCUE Link H150i LCD 360mm AIO
Cooling: 8x Corsair iCUE Link QX120 120mm fans
PSU: 1200W Corsair RMx Shift 80+ Gold PSU
SSD: 2TB Gigabyte Aorus Gen5 12000 M.2 PCIe 5.0 SSD
Case: Geometric Future Model 8 Dharma
As for the benchmarks themselves, for synthetic testing, I’m using a mixture of 3D Mark and Blender. 3D Mark provides an index for each test, which gives us a nice, easy-to-read, comparable metric to look at, to easily identify performance across all of our cards at a quick glance. Blender however is a bit more specialised, and specifically provides solid insight into how these cards perform in rendering-oriented tasks.
For gaming, I’ve chosen a selection of seven modern titles, all of which are tested across all three resolutions. That includes Total War: Warhammer 3, Cyberpunk 2077, Red Dead Redemption 2, and a few others as well. All games are tested on the highest graphical preset available. Some of which contain ray-tracing elements by default. In the case that DLSS, FSR, or Intel’s XeSS is enabled by default in those profiles, it’s disabled for the duration of the stock tests.
Performance and Benchmarks
- 4K gaming is easily within reach
- RTX 4070 Super still outclasses it
- Ray tracing performance lagging behind Nvidia
All in all the RX 7800 XT has produced some stellar results across my testing suite. At 4K in particular, the 7800 XT managed an impressive 70 fps in RDR2, 69 in Borderlands 3, and 46 in Total War: Warhammer 3.
Average frame rate across all seven titles at 4K was 55.0, with the score heavily pulled down by Cyberpunk 2077, which, with ray tracing enabled and FSR disabled, scored a savage 13 fps on average. Although that’s not exactly surprising given how aggressive a game it is on that graphical frontier.
Interestingly the RTX 4070, only manages 51.86 fps at 4K on average across all titles, but did manage 17 fps in Cyberpunk, a 30.7% performance increase in comparison. Nvidia still clearly has the lead in the dedicated ray tracing hardware race that’s for sure. However, in titles with Vulkan, or DX12, AMD scooped the win leading to that higher average frame rate across the board. No doubt helped in part thanks to the 7800 XT’s 16GB of VRAM versus the 4070’s 12GB. That said, compared to the RTX 4070 Super, the table shifts again, with Nvidia taking the lead back, with 59.71 fps on average across all seven titles. Although again, that’s at a $100 price difference between the two.
Ray Tracing and Upscaling
- FSR leads to impressive performance boost
- Ray tracing performance isn’t quite as strong as Nvidia
- FSR not available in all titles
I also tested the RX 7800 XT extensively across a number of different titles that support both ray tracing and AI upscaling as well, just to get a good idea as to how FSR 2.0 performs. I test each card in four different graphics configurations, across three titles at 4K so we have a good understanding of just how it compares here.
FSR 2.0, AMD’s flagship new AI upscaling tech, debuted with the launch of the 7800 XT in September of 2023, so I wasn’t exactly surprised to see that this tech significantly boosted frame rates. Cyberpunk being the prime example, went from 13 fps average at 4K to a stunning 39 fps, that’s a 200% performance increase at this resolution just from enabling FSR. Without ray tracing enabled, FSR still leads to some significant increases as well, with average frames going from 38 to 57, a respectable 50% increase in performance here too.
In F1 2022, scores equally bounced up significantly, with ray tracing on, and FSR on, increasing average frame rates from 33 to 63, and non ray traced framerates from 117 to 156, respectively, bringing it close to on par with Nvidia’s DLSS 3.0 tech as well. Although there’s certainly some debate on which form of AI upscaling looks better, it’s great to see a tight competition on this front.
Power Consumption and Temperature
Efficiency on the whole for the RX 7800 XT was also pretty solid, full system power draw came out at 606.5W maximum (ironically on par with Intel’s Arc A750), and idle load topped out at 184.8 W, that’s slightly higher than the RTX 4070 and 4070 Super, although not by much.
Temperatures also remained well within acceptable parameters, with the GPU topping out at 84.4 C, with the hot spot at 106.0 C. Max clock speed, hit a hefty 2,737 MHz on my reference unit too. You’ll likely find better clock speeds and temperatures on aftermarket cards from the likes of Asus, Gigabyte, MSI, and others as well.
Latest deals
Should you buy it?
You want a fantastic 4K GPU
AMD’s Radeon RX 7800 XT absolutely kills it at 4K gaming, hitting an average of 55 fps across all of our seven gaming benchmarks. At this price, it’s remarkably good value for money, and the 16GB VRAM should keep you comfortably gaming at UHD for many years to come.
You’re looking for the best ray tracing performance
Although AMD’s FSR tech has now caught up with DLSS, its dedicated ray tracing hardware still has some catching up to do. Nvidia’s still in the lead here, and if you want better ray tracing performance your best bet is to pick up an RTX 4070 Super instead.
Final Thoughts
AMD’s Radeon RX 7800 XT is an impressive GPU. Its current price point paired with some fantastic 4K performance, makes it a solid pick for anyone looking to build a decent 4K gaming PC. It might not be the best graphics card out there right now, in terms of brute performance, but the value per $ and framerates you get, easily make up for it.
If you live and breathe ray tracing, and need it in all of your titles however, you might be better off with something like Nvidia’s RTX 4070 Super, which still has a competitive edge in raw ray tracing performance, for only a 20% extra investment.
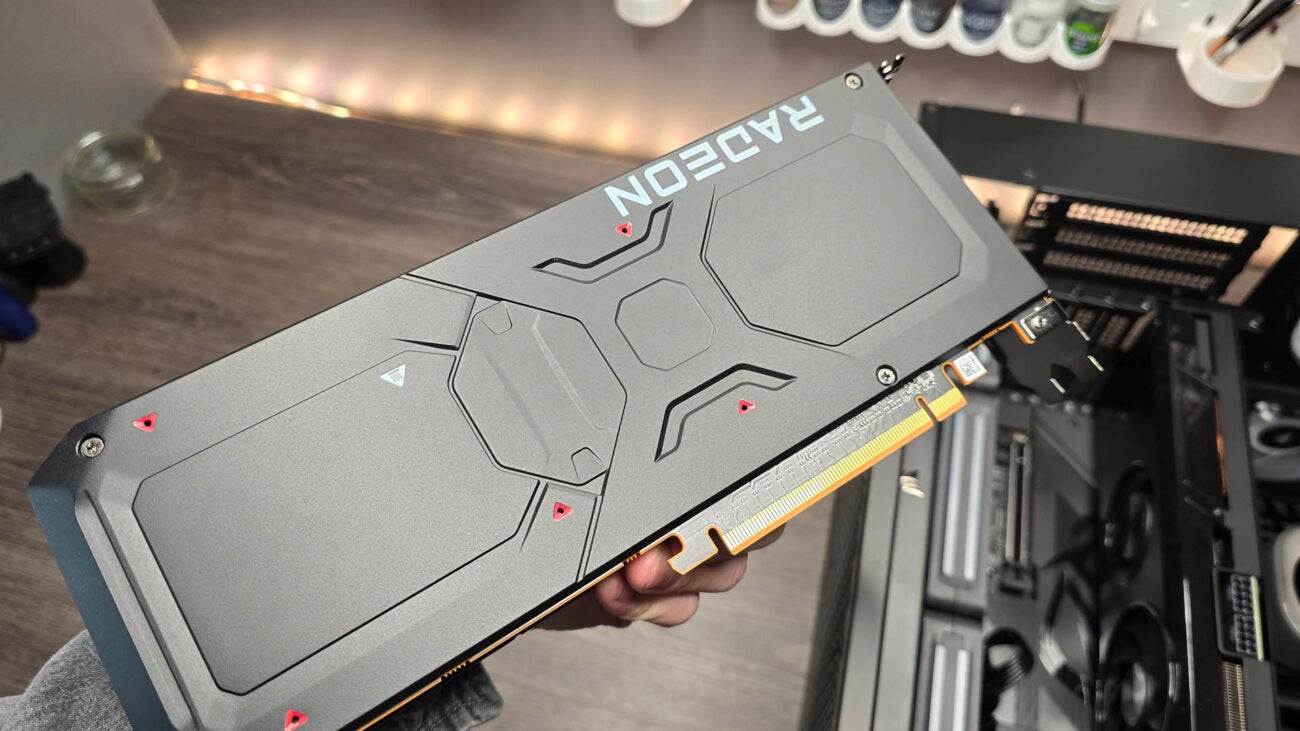
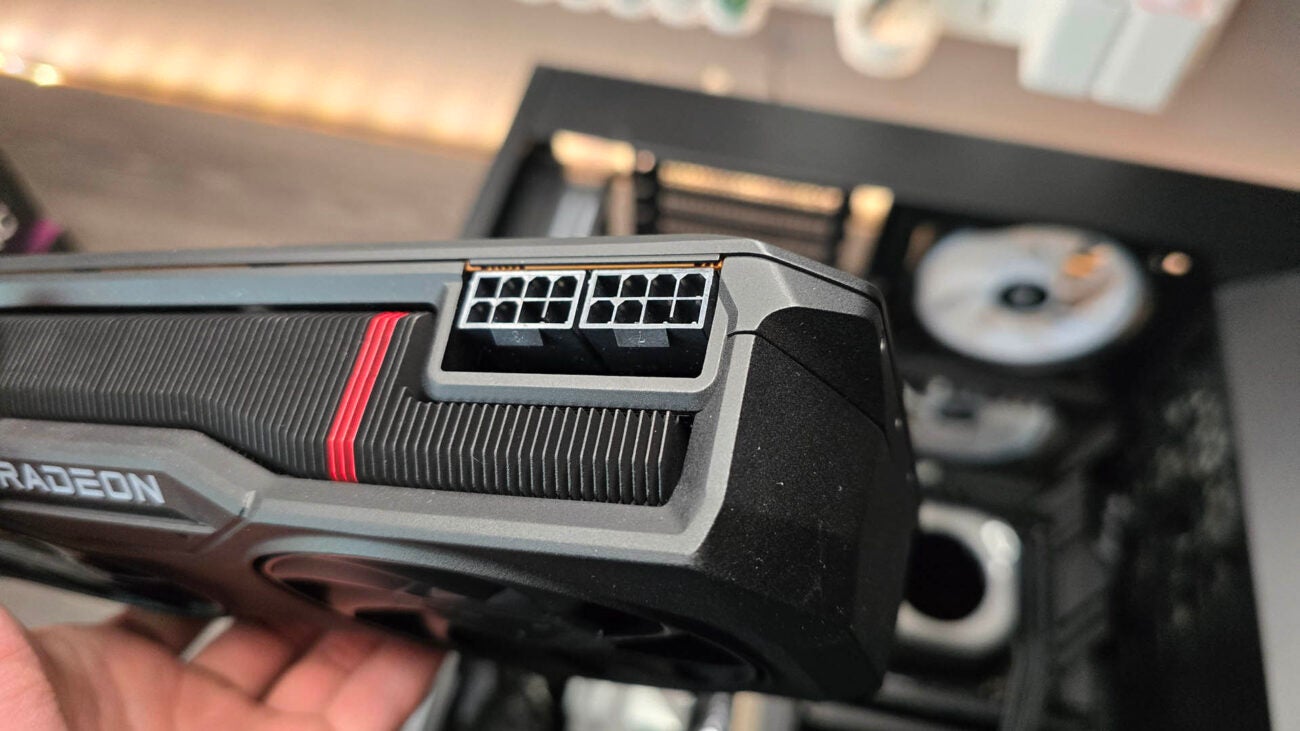
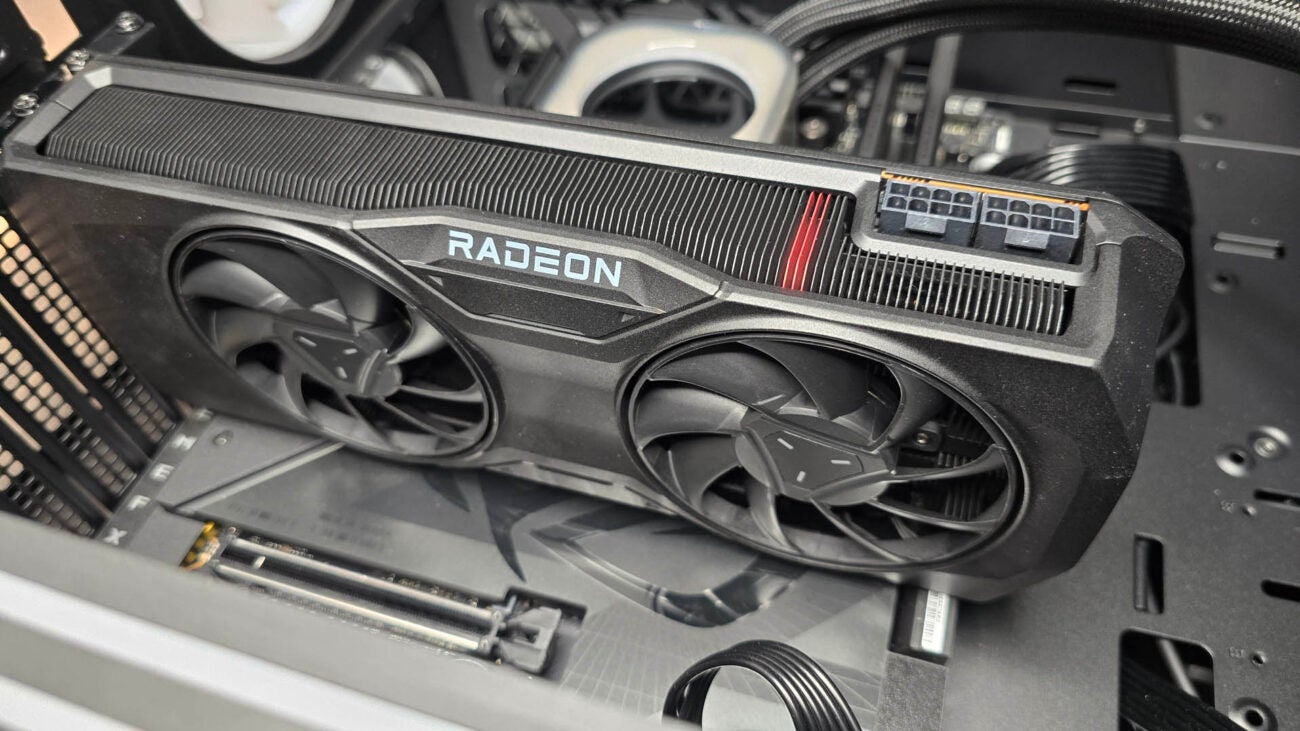
Otherwise, power draw and temperatures, although slightly hungrier than Team Green’s offerings, are still well within acceptable ranges, and the reference card looks stunning in any rig, complete with its traditional PCIe power connections too.
How we test
Each of the graphics cards we test is installed into a dedicated test-bed. After which point multiple different benchmarks are run to stress test the card, at a variety of different resolutions. We also monitor power draw and temperature throughout this procedure.
installed in a dedicated test pc
Tested with gaming benchmarks
Power draw and temperature monitored
FAQs
Yes it easily hits 55 fps across the majority of our 4K game tests, and with FSR enabled that number skyrockets higher too.


